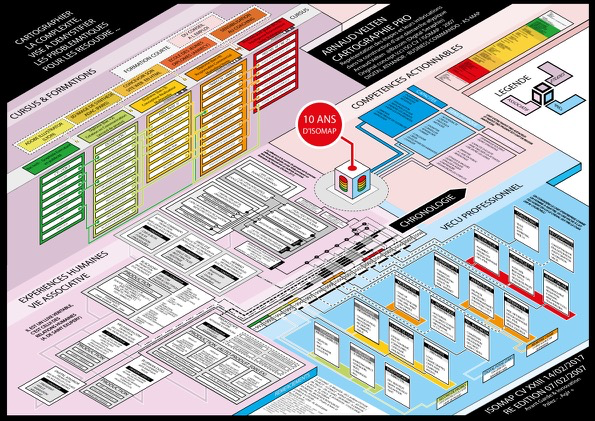
Voilà 10 Ans : Sans Emploi … Epuiser par la question, LA QUESTION : “Pouvez vous m’expliquez votre parcours … Parce que vous avez fait : graphisme / communication / audiovisuelle / marketing & management / veille & intel éco …” Je me suis dit que je devait faire la “démonstration de l’apport de l’infographie cartographique pour faciliter la cognition ”…
TorFlow est un ensemble de script Python dont le but est de vous permettre d’analyser et de visualiser en temps réel le trafic du réseau #Tor, à l’aide d’une magnifique carte interactive. Vous pourrez ainsi obtenir diverses informations concernant le routage, les nœuds performants ou engorgés et tout un tas d’autres choses intéressantes. Ce projet a…
#Chartopedia is an information resource that allows you to discover as many details about any type of chart supported in Source: Chartopedia | AnyChart
A collection of #tools for all your journocoding needs. Filter your search to find just the kind of tool you are looking for right now. Source: Data journalism tool collection | Journocode
The Most Valuable Substances by Weight #Infographic #Trading #Finance Source: Perte de poids, 12 semaines and Facteur venus on Pinterest
Cartoon : #Roue des Emotions / #Emotion Wheel Si vous trouvez l’auteur de cette Roue Merci de me donner son Site 😉 If you find Cartoon author please contact me 🙂 Download Emotion Wheel Source : http://www.christinejayne.co.uk/blog/?p=1
https://www.weforum.org/agenda/2016/06/8-digital-skills-we-must-teach-our-children
Source Unkown : If you have notice me