http://bigdataanalyticsnews.com/7-data-visualization-tools-big-data/
Here are top 7 Data Visualization Tools for Big Data
1. Raphael
A JavaScript library for creating vector graphics on the web, Raphael uses SVG and VML so that every graphic created is also a DOM object. Raphael’s goal is to enable vector graphics creation with cross-browser compatibility.
Key Features:
Include Raphael.js in a web page for functionality
Create a variety of charts, graphs and other data visualizations
Multi-chart capabilities
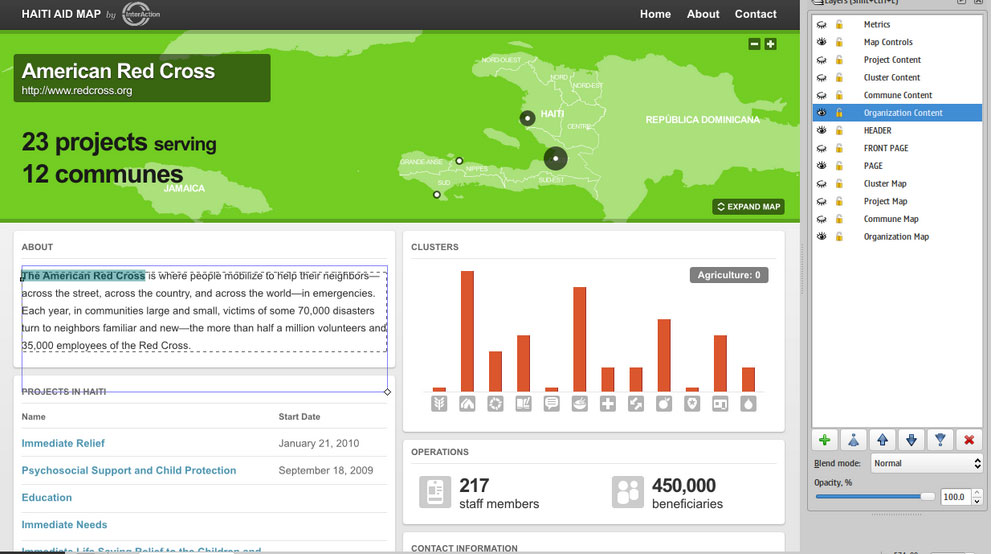
2. Inkscape
 Inkscape offers functionality similar to that of more expensive applications, such as Corel Draw and Illustrator, yet it’s an Open Source editor for vector graphics. Inkscape supports many advanced SVG features for ease of use and encourages developer collaboration in a community environment.
Key Features:
Handles complex graphic tasks similar to standard software
Native SVG format
Create website mockups
Bitmap import and display capabilities
Files stored as vector graphics
3. Leaflet
An Open-Source JavaScript library, Leaflet is a tool for creating mobile-friendly, interactive maps. Developed by Vladimir Agafonkin and a team of contributors, Leaflet was designed with the goals of simplicity, performance and usability.
Key Features:
Works on all major desktop and mobile browsers
Various plugins for extended capabilities
Incorporate interactive features
Multiple available map layers
CSS3 features for streamlined user interaction
Eliminates tap delay on mobile devices
4. Crossfilter
Exploring large multivariate data sets in a browser is made possible by Crossfilter, a JavaScript library that’s capable of handling data sets with more than a million records. Crossfilter uses semantic versioning and creates data visualizations easily using values, objects and other components and commands for customization. It was actually built to power analytics for Square Register to enable merchants to manipulate sales and purchase data
5. OpenLayers
Insert a dynamic map on any web page with OpenLayers. It implements a JavaScript API for building web-based geographic applications and works in most modern web browsers with no server-side dependencies. It’s an open-source software with a new edition in the works, OpenLayers 3, which incorporates the most recent HTML5 and CSS features and enhance 3D capabilities.
6. Kartograph
A Python library and JavaScript library in one, Kartograph caters to developers who want to create Illustrator-friendly SVG maps and interactive maps that will work across all major browsers.
Key Features:
Two libraries: Python and JavaScript
Kartograph.js creates interactive maps in minutes
Stand-alone; no server required
Kartograph.py creates compact SVGs using Visvalingam simplification
Layer data sets on maps for multi-layer visualization
7. Microsoft Excel
Microsoft Excel is widely noted for its data manipulation and analysis capabilities, but it’s often used to create powerful data visualizations. The latest edition of Excel is packed with visualization tools, including recommended charts, quick analysis of the different ways to display your data, and a multitude of control options to change the look and layout of your visualizations.
Key Features:
Perform data analysis and create visualizations in the same program
Compare various ways to represent your data
Change tile, layout and other format options
Excel recommends the best visualization for your data
Compatible with Microsoft Office products


